History tab
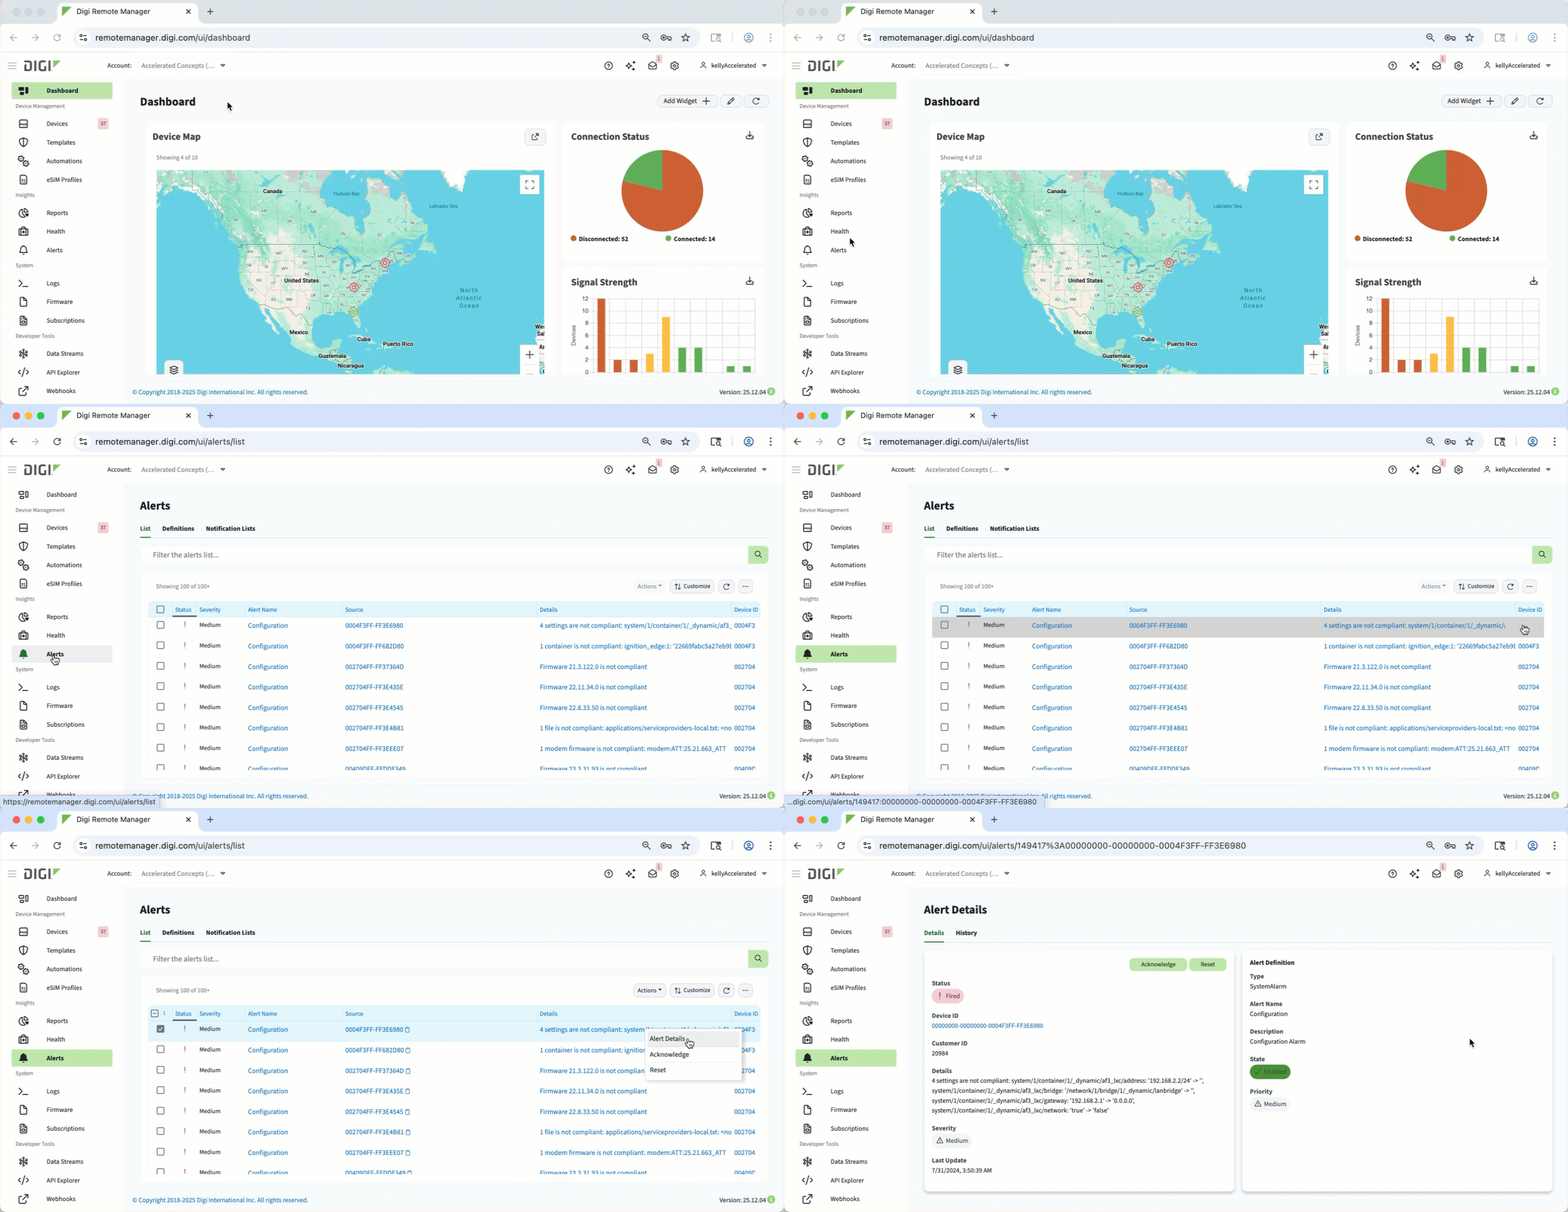
 You can view the history of an alert from the History tab on the Alert Details page. On this tab, you can see a timeline of events to track response actions and identify recurring issues. Reviewing this information ensures effective monitoring and supports troubleshooting or performance analysis across your devices.
Click the Chart icon to see the data in either a chart format (default view) or a table format. In the chart view, click the Meatball icon to download an image file (PNG, JPEG, SVG) or to export a data file (CSV or XLSX). In the table view, click the Meatball icon to export a data file (CSV or XLSX).